Deal or No Deal Fansite and Forum: Welcome to DOND, the home of Deal or No Deal fans.

Deal Or No Deal
Deal or No Deal Fansite and Forum: Welcome to DOND, the home of Deal or No Deal fans.
It is currently Sat Apr 20, 2024 7:20 am Last visit was: Sat Apr 20, 2024 7:20 am


Contestant applications for the 2024 filming of Deal or No Deal are now OPEN! More info here.


New user? Register to join in! Returning user? Login (or reset your password).

Deal or No Deal forum index » UK DoND Forums » Deal or No Deal StatisticsAll times are UTC [ DST ]


 [ 7 posts ] 
Author Message

TicTac

PostPosted: Fri Oct 27, 2006 12:40 am    Author: TicTac    Post subject: TicTac's DOND Graphs - Offers/Stats e.t.c.

Joined: Tue Jul 11, 2006 12:01 am
Warnings: 0
Hi all,

I was bored today so have been having fun messing around with some graphs that may be of interest to others.

Image

I'm not sure it turned out great; its a little difficult to understand but there are some interesting bits of info that can be learnt from the graph.

I didn't include offers 5 and 6 as they would have clogged up the graph too much making it difficult to understand. I might try using those for another graph.

All joke offers (like Lucy's £50, John G's 8 pounds, and the Swap Offers) are not included when the average is calculated.

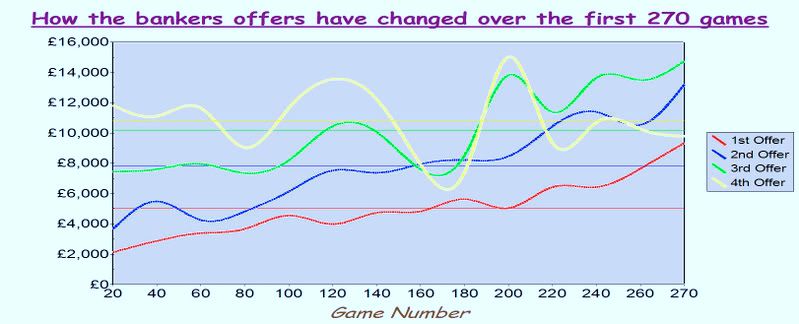
The key shows which offer each line refers too.

The straight lines show what the mean is of a certain offer for the first 270 games. e.g. the straight yellow line is the average 1st first offer for the first 270 games.

1st Offer - Deal of 17
2nd Offer - Deal of 14
3rd Offer - Deal of 11
4th Offer - Deal of 8

What I thought:

1st Offers have risen relatively uniformly continuing to rise more steeply in recent games. I will be surprised if 1st offers keep rising for much if any longer.

2nd offers have had to follow the same trend as 1st Offers so it shows no surprises that the line is similar, just with an average of £2,500 more. The gap between 1st and 2nd offers has got larger and larger showing in strong starts the bank has increased his offer more and more.

The 2nd offer will reach the average winnings soon if the banker doesn't calm down his inflated early offers. (not necessarily a bad thing)

Offer 3 starts to get into the realm of depends-on-the-game, and when this is a graph of actual offers rather than generosities it can just depend on the strength of the game, but what is interesting is the following:

Offer 4 is always around £2,500 to £4,000 higher than Offer 3 on average until Game 140 where both decline sharply, probably due to a run of bad games. They both rise sharply as well mainly due to a run of strong games but possibly the bank is experementing with generosities and varying the offers a lot. When the two lines come out of their large oscillation at around Game 210 it is Offer 3 not Offer 4 that is around £2,500 to £5,000 more than offer 3 - completely different to what happened for the first 140 games.

The fact that offers 1 and 2 have increased signficantly and Offer 3 to an extent, and Offer 4 is currently a little lower than the earlier games show a possible strategy to make the player have to turn down larger values at first, but then receive lower offers later on to make the player to play on to chase their high earlier offers or to create more dramatic finishes.

For the last 20 games in fact, on average it has been only slightly worse to gon the 1st offer than the 4th offer with the 2nd and 3rd offers being the best time to go.

Considering that for the last 40 games going at the 2nd offer has been better than going at the 4th, it is surprising that we still don't have any dealers at that time.

Comments/thoughts, other analysis is welcome. Ideas or requests for other graphs anybody would like to see is welcome.

That was probably OTT and too complicated so it probably won't be that useful, but hey, I had fun doing it :D

*All thanks to the screwthebanker spreadsheet*


Last edited by TicTac on Fri Oct 27, 2006 2:05 pm, edited 3 times in total.

Top
 Profile  

h2005

PostPosted: Fri Oct 27, 2006 9:57 am    Author: h2005    Post subject: Re: TicTac's DOND Graphs - Offers/Stats e.t.c.
Administrator & Global Moderator
User avatar

Joined: Thu Feb 16, 2006 3:13 pm
Location: Chelmsford, Essex
Warnings: 0
Good graph!

TicTac wrote:
The fact that offers 1 and 2 have increased signficantly and Offer 3 to an extent, and Offer 4 is currently a little lower than the earlier games show a possible strategy to make the player have to turn down larger values at first, but then receive lower offers later on to make the player to play on to chase their high earlier offers or to create more dramatic finishes.


Mmm...I also thought that's what the banker's up to...

By the way, is each offer an average over 5 games or something?


Top
 Profile  

TicTac

PostPosted: Fri Oct 27, 2006 11:16 am    Author: TicTac    Post subject:

Joined: Tue Jul 11, 2006 12:01 am
Warnings: 0
Thanks for the comments h2005.

For the graph, I made a 20 point true moving average for each offer, and then took every 20th value for the graph.

With that meaning that each point is the average offers for the last 20 games normally the good and bad games balance out over that time and the graph is reflects the generosities of the offer.


Top
 Profile  

MisterAl

PostPosted: Fri Oct 27, 2006 1:41 pm    Author: MisterAl    Post subject:
User avatar

Joined: Thu Feb 09, 2006 11:50 pm
Warnings: 0
That's brilliant.

It'd be interesting to do the same thing but based on %-of-the-mean, rather than the actual offers. I'd be really interested to see whather that big dip at around show 180 was due to bad boards or to a different Banker strategy.

My spreadsheet is automatically set up to calculate %-of-the-mean at each offer stage so maybe I'll have a go at that myself.


Top
 Profile  

justcause110

PostPosted: Fri Oct 27, 2006 1:51 pm    Author: justcause110    Post subject:
User avatar

Joined: Fri May 12, 2006 8:14 pm
Location: Jersey
Warnings: 0
Very interesting, good to compare using the graphs.

Good idea


Top
 Profile  

rico7

PostPosted: Fri Oct 27, 2006 7:03 pm    Author: rico7    Post subject:
User avatar

Joined: Mon Feb 13, 2006 10:36 am
Location: Stratford-upon-avon, Warwickshire
Warnings: 0
Interesting stuff, are you planning to do one based upon the fifth offers?


Top
 Profile  

h2005

PostPosted: Thu May 31, 2007 2:58 pm    Author: h2005    Post subject:
Administrator & Global Moderator
User avatar

Joined: Thu Feb 16, 2006 3:13 pm
Location: Chelmsford, Essex
Warnings: 0
I think it'd be interesting to see a graph based on the recent offers - the banker's offers were huge around March time, in both in-play and in proveout, and now they seem to be tailing off again... and we're seeing some very low offers being made! :shock:


Top
 Profile  
Display posts from previous:  Sort by  
 [ 7 posts ] 
Deal or No Deal forum index » UK DoND Forums » Deal or No Deal StatisticsAll times are UTC [ DST ]


Who is online

Users browsing this forum: Bot and 0 guests


You cannot post new topics in this forum
You cannot reply to topics in this forum
You cannot edit your posts in this forum
You cannot delete your posts in this forum

Jump to:  

Deal Or No Deal

[ View who is online ]

Powered by phpBB © 2000, 2002, 2005, 2007 phpBB Group
Copyright ©2023 dond.co.uk All rights reserved

www.dond.co.uk is not responsible for the content posted by private individuals on this website. The views expressed herein are solely the opinions of the individuals that produced them and not necessarily the views of the owner, or of the admins, or of the moderators of this website.


Admin Zone Directory